The Math and Code Behind…
Facial alignment is a prereq…
2 years, 10 months ago
by Sabbir Ahmed

In this article, we will explore how to securely and reusably instrument a Go web service for CPU and memory profiling. We won’t use any third-party package for the project. All we need is net/http !
Let’s clone the repo and dig in -
In this project, we’ll create a hypothetical concurrent task of generating 1000 random numbers when a user visits /fakework API. So let’s begin with this function first let’s create a file named handlers.go —
// work function generates a random number and sends it into a channel
func work(task int, ch chan map[string]int) {
 s := rand.NewSource(time.Now().UnixNano())

 r := rand.New(s)
 ch <- map[string]int{
  "task no":          task,
  "generated number": r.Int(),
 }

}

// fakeWork is the Handlerfunc generating 1000 random number concurrently
func fakeWork(w http.ResponseWriter, r *http.Request) {
 ch := make(chan map[string]int)
 for i := 0; i < 1000; i++ {
  go work(i, ch)
 }

 for i := 0; i < 1000; i++ {
  mb, _ := json.Marshal(<-ch)
  w.Write(mb)
 }
}
Now, binding them with net.ServeMux will get us the expected result,
// AppHandler declares the business service structure.
type AppHandler struct {
 Server *http.Server
 Route  *http.ServeMux
}

// NewAppHandler initiates the AppHandler and Maps the internal routes.
func NewAppHandler() *AppHandler {
 h := &AppHandler{}

 h.Route = http.NewServeMux()

 h.Server = &http.Server{
  Addr:    "0.0.0.0:8080",
  Handler: h.Route,
 }

 h.mapAppHandler()

 return h
}

func (a *AppHandler) mapAppHandler() {
 a.Route.HandleFunc("/fakework", fakeWork)
}
Here, I simply declared a struct with Server and Route . This will work as our service. The Route will act as our current custom ServeMux where we can map our custom Routes with their corresponding business logic and Http Handler.
Initiating the app is easy, create main.go and paste —
func main() {

 // initialize web app
 app := NewAppHandler()

 log.Println("webapp at http://localhost:8080/fakework")
 log.Println(app.Server.ListenAndServe())

}
Let’s test out the setup —
curl http://localhost:8080/fakework
# expected output
{
  "generated number": 8822173978106890000,
  "task no": 208
}
{
  "generated number": 7965915303054558000,
  "task no": 185
}
Profiling with net/http/pprof is honestly the easiest and most intuitive approach, I have ever seen! We don’t even need a custom Mux for this, this will by default use the http.DefaultServeMux So, just by importing the pprof package technically is enough!
create a file named profiler.go —
import (
  ...
 _ "net/http/pprof"
)

// ProfilerHandler declares the profiler service structure.
type ProfilerHandler struct {
 Server *http.Server
 Route  *http.ServeMux
}

// NewProfilerHandler initiates the ProfilerHandler and Maps the profiler routes.
func NewProfilerHandler() *ProfilerHandler {

 h := &ProfilerHandler{}

 h.Route = http.NewServeMux()

 h.Server = &http.Server{
  Addr: "0.0.0.0:3030",
 }

 return h
}
and now modifying the main.go for initiating this is enough —
func main() {

 // initialize profiler service
 debug := NewProfilerHandler()

 go func() {
  log.Println("profiler at http://localhost:3030/debug/pprof")
  fmt.Println(debug.Server.ListenAndServe())
 }()

 // initialize web app
 app := NewAppHandler()

 log.Println("webapp at http://localhost:8080/fakework")
 log.Println(app.Server.ListenAndServe())

}
You may have observed that I have set up two ports for the service: one for the actual business functionality 8080and another for debugging purposes 3030. This is language-agnostic standard practice for production applications, as it helps to keep the business ports secure by isolating the debug endpoints. This way, we can host our applications safely without exposing the sensitive business ports. And Go makes it easy to maintain and deploy. Here, the parent thread contains the business server and a separate child thread contains the debug processes.
Though this is enough for profiling a Go service, I would like to mention one of my personal preferences, “Explicit is better than implicit”. This comes from my Python background, but I think it applies here. Let’s refactor the profiler.go file to have the explicit debug endpoints from pprof —
// NewProfilerHandler initiates the ProfilerHandler and Maps the profiler routes.
func NewProfilerHandler() *ProfilerHandler {
 h := &ProfilerHandler{}

 h.Route = http.NewServeMux()

 h.Server = &http.Server{
  Addr:    "0.0.0.0:3030",
  Handler: h.Route,
 }
 h.mapProfileHandlers()

 return h
}

//
func (p *ProfilerHandler) mapProfileHandlers() {
 p.Route.HandleFunc("/debug/pprof/profile", pprof.Profile)
 p.Route.HandleFunc("/debug/pprof/heap", pprof.Index)
 p.Route.HandleFunc("/debug/pprof/trace", pprof.Trace)
 p.Route.HandleFunc("/debug/pprof/symbol", pprof.Symbol)

}
This allows us to reuse the setup for any other framework or mux libraries ie. Gin and gorilla/mux. Also, we can get rid of the DefaultServeMux with this simple tweak.
So far so good… We just need to verify if the profilers are working correctly —
To generate a small load let’s create a simple bash script
while true;
  do curl http://0.0.0.0:8080/fakework | jq ;
  sleep .5;
  done
Let’s keep the script running in a terminal. And open another one to capture the sessions. We’ll go through the CPU profile, Memory profile, and Tracing in this example —
To capture the CPU profile run the following command —
curl -o prof.pb.gz http://localhost:3030/debug/pprof/profile\?seconds\=30
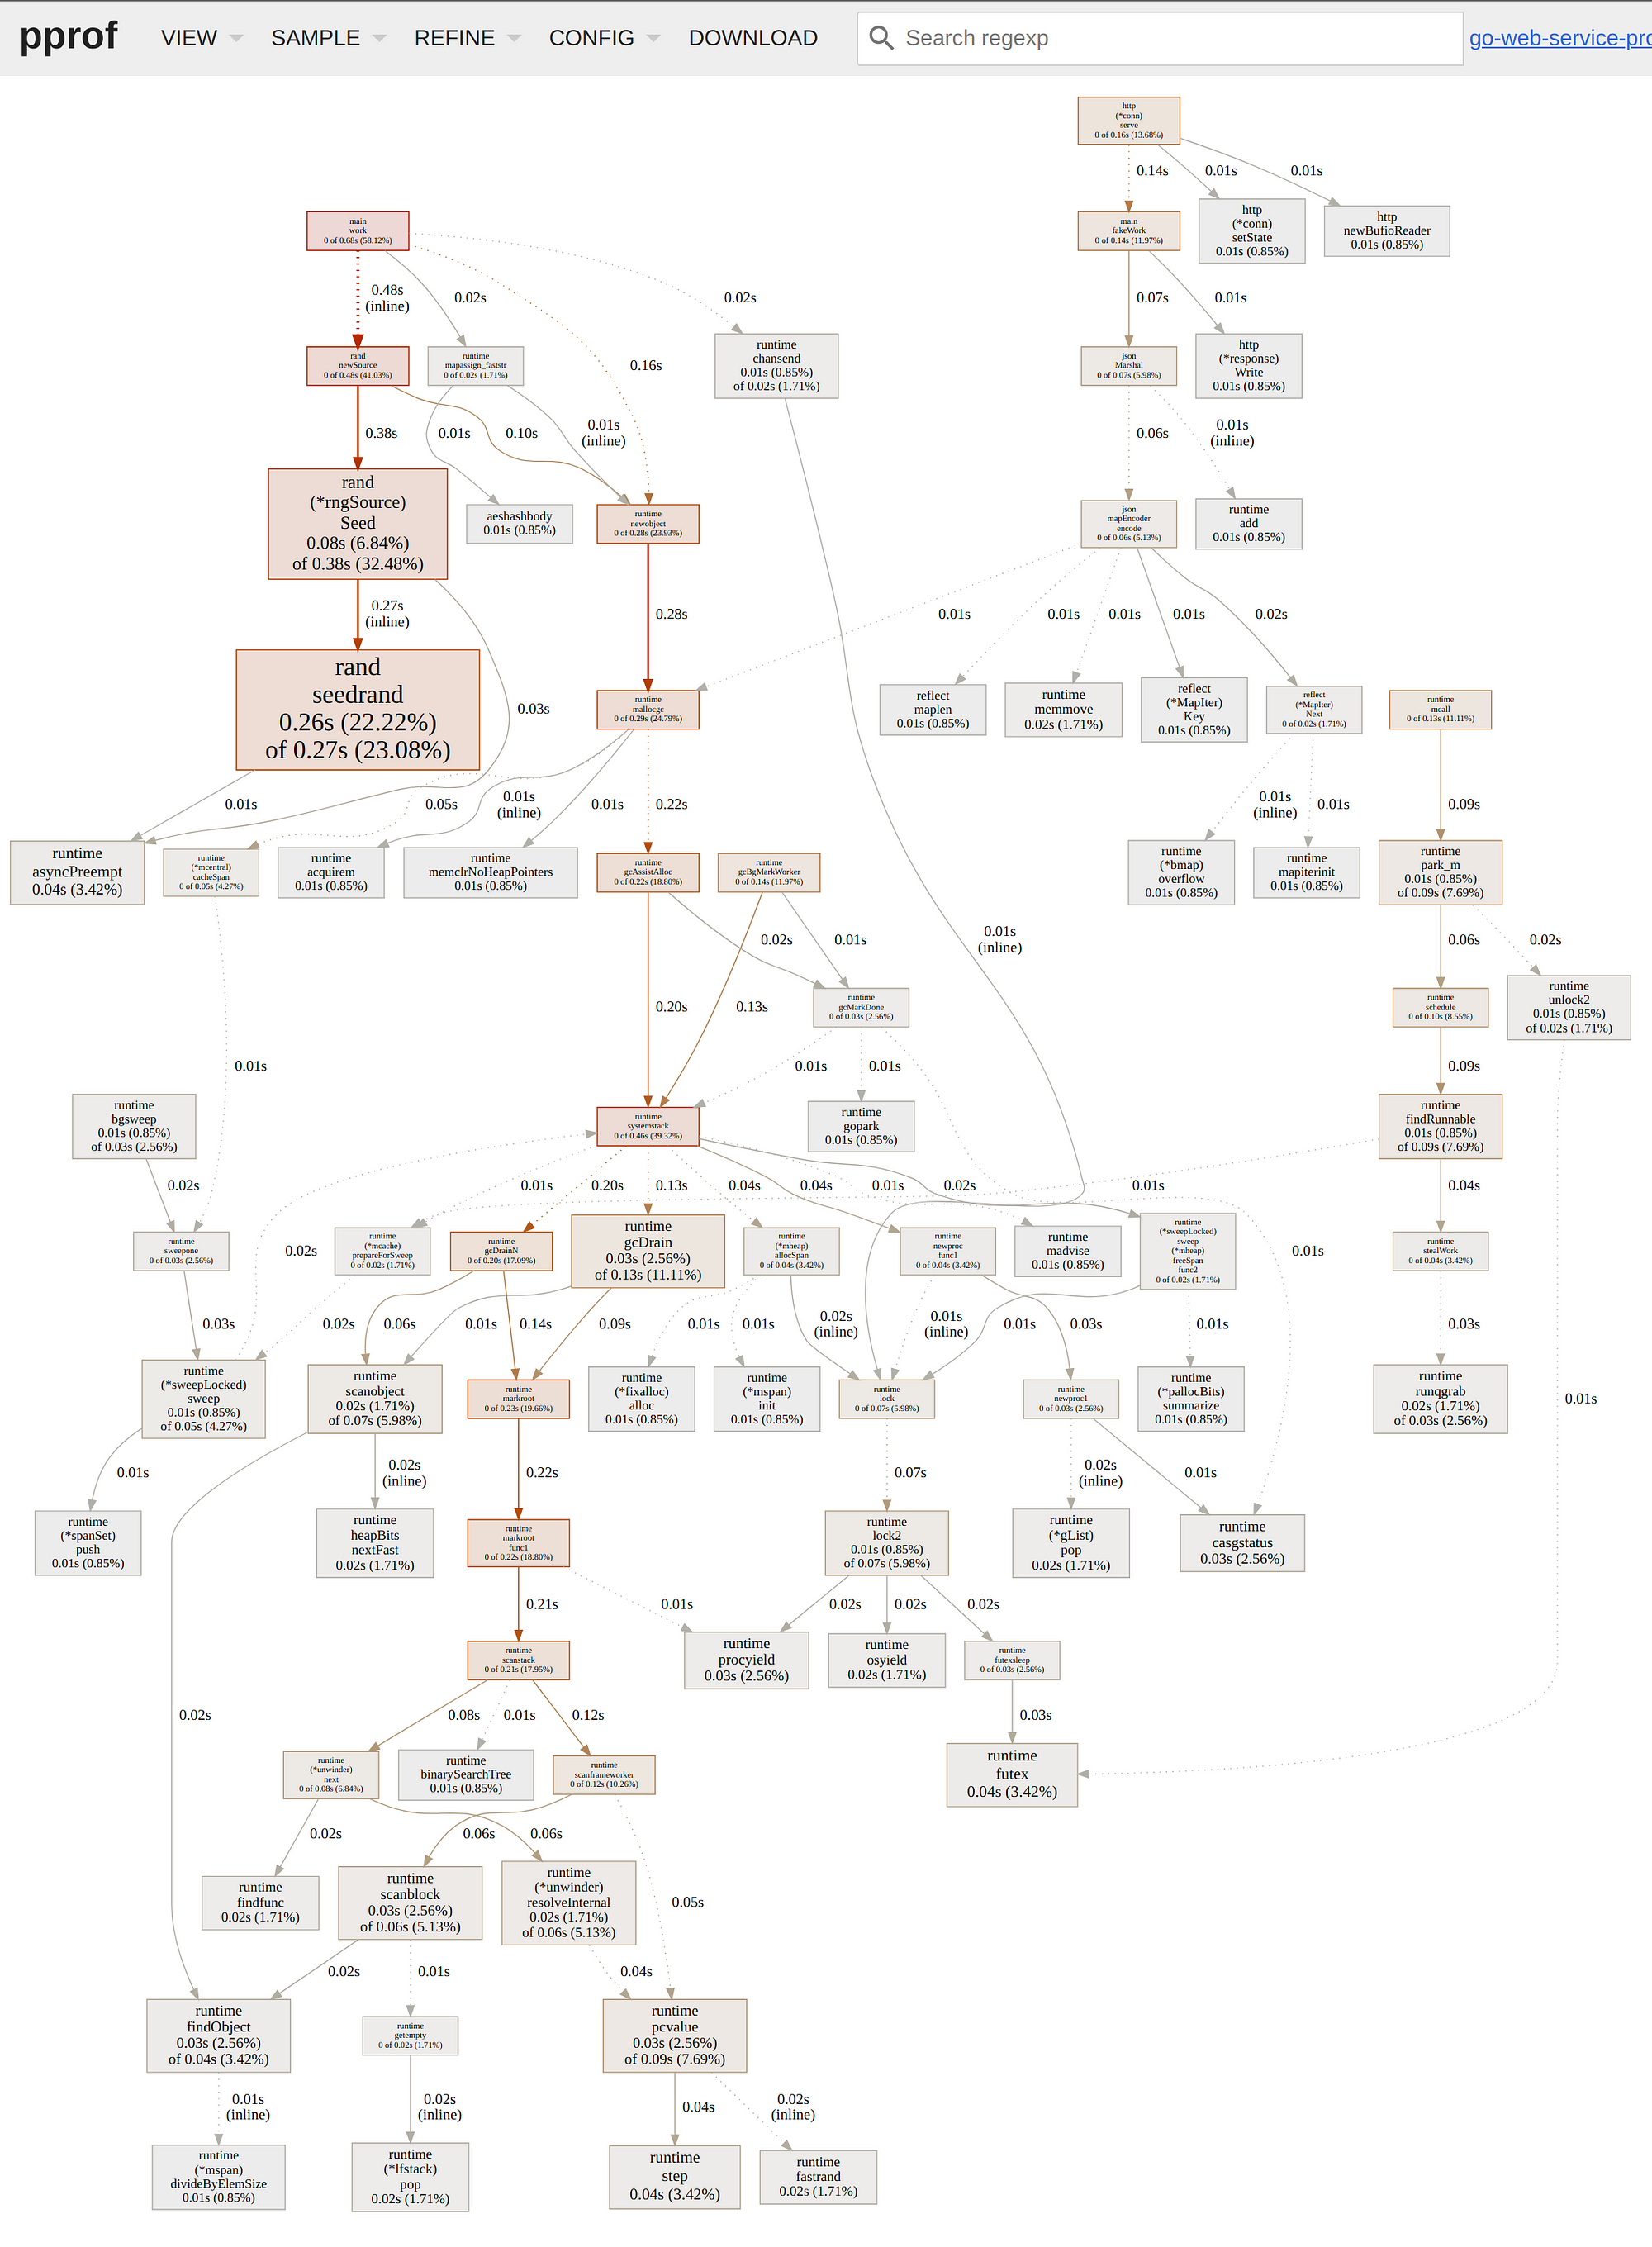
This will record a 30 second CPU profile and download a file naming prof.pb.gz let’s visualize this with pprof web-ui tool
go tool pprof -http localhost:9999 prof.pb.gz
You’ll get something like this —

CPU Profile Graph View
Similarly to capture the Memory profile run the following command —
curl -o prof.pb.gz http://localhost:3030/debug/pprof/heap\?seconds\=30
This will record a 30 second CPU profile and download a file naming prof.pb.gz let’s visualize this with pprof web-ui tool
go tool pprof -http localhost:9999 prof.pb.gz
Now select one sample and You’ll get something like this —

Memory Profile Flame Graph View
Notice that, I have selected graph view for CPU and Flame Graph for Memory. This is also a personal preference.
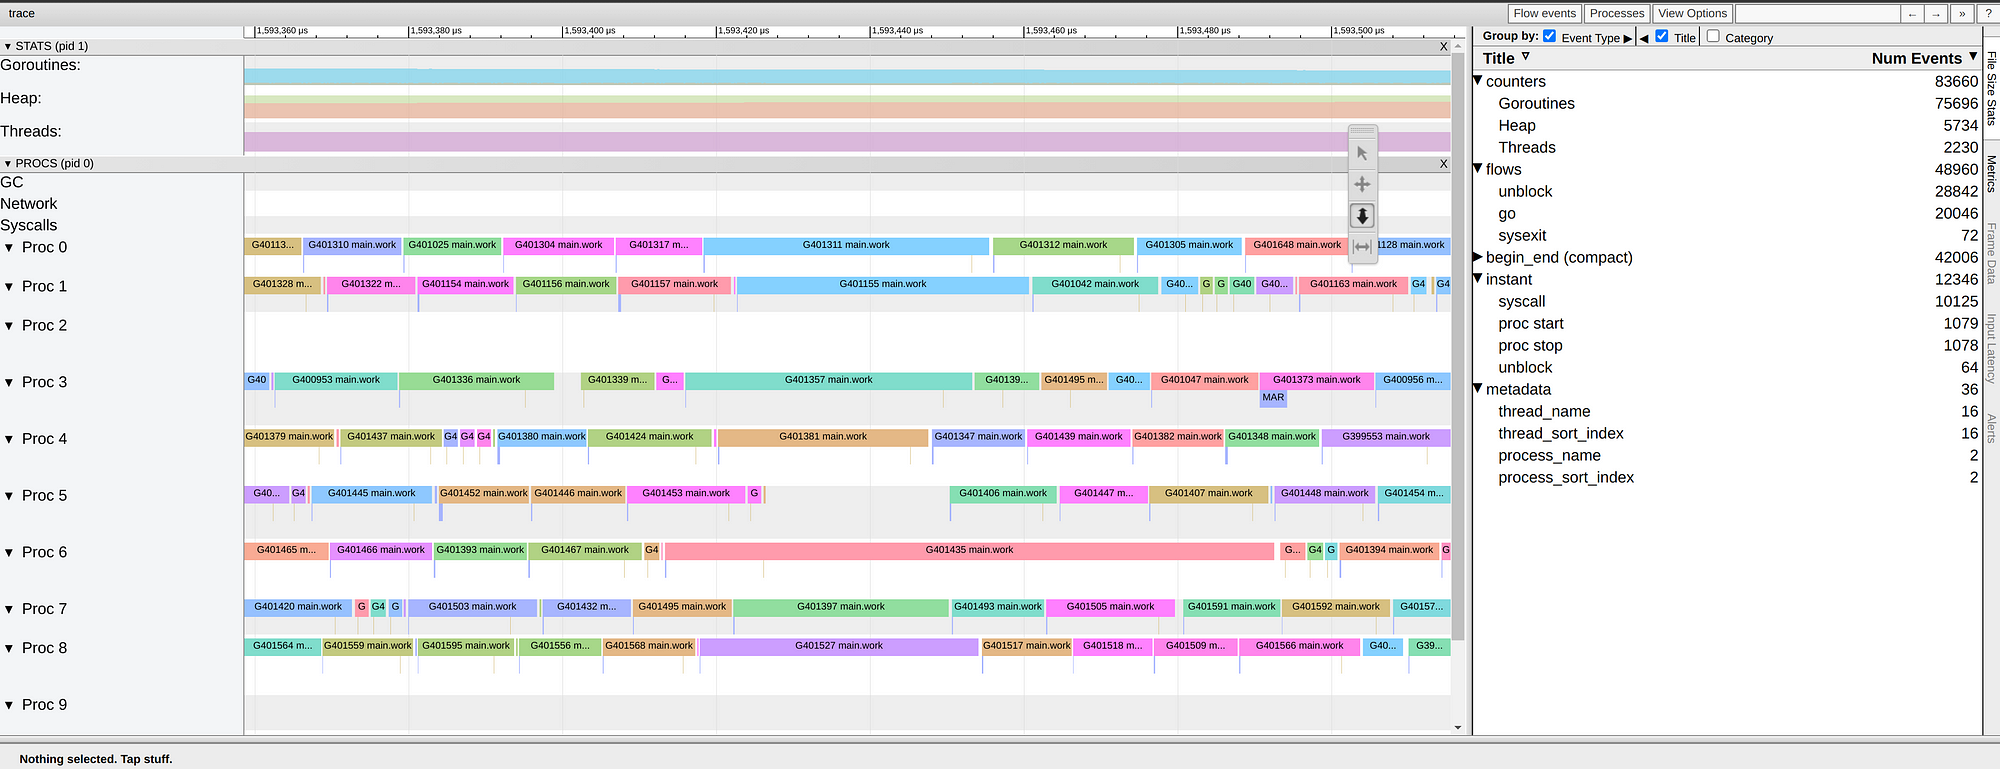
Tracing will differ a bit from profiling as it uses the tracing tool
curl -o trace.out http://localhost:3030/debug/pprof/trace\?seconds\=5
To visualize use the following command —
go tool trace trace.out
We will have something like the following —

Traces are an awesome source for understanding goroutine usage, max procs usage, blocking calls, etc.